Loading
CAP-Digital Scorer is a digital tool for scoring, calculating and compiling graphic profiles from CAP.
CAP-Digital Scorer was developed in collaboration between Neuroguide.dk and Ruth Deutsch and is sold as an independent supplement to the CAP material.
Advantages of using CAP-Digital Scorer
With only one data entry, it....:
Prerequisites
It is a prerequisite for using CAP-Digital Scorer that you have Microsoft Excel (not included) that can be used on PC or Mac computers.
The CAP-Digital Scorer tool is not a stand-alone tool. It is intended for use after the first baseline consultation, for which the printed CAP Record Form is required. Subsequently, the CAP-Digital Scorer can be used to generate digital profiles for print or insertion into reports. Additionally, one copy of the manual Summary Form should be placed in the learner's file
(For ordering and information on copyright for the printed manual and forms, please refer to https://www.dynamicassessment.co.uk/cognitive-abilities-profile/).
How to order
CAP-Digital can be ordered online as an add-on when you sign up for future webinar. Or it can be ordered by email correspondence: cap@neuroguide.dk After email ordering you will receive an invoice with payment information. We are working on a digital payment option.
Pricing
CAP-Digital Scorer single-user license costs 140 Euro + VAT. Price in total: 175 Euro
CAP-Digital Scorer multi-user license (covers up to 5 users from the same office) costs 360 Euro + VAT. Price in total: 450 Euro
Download
This digital product description is available for download in pdf here:
FULL CAP-DIGITAL SCORER DESCRIPTION IN PDF
Support and Contact information
We are available to support you in using the CAP-Digital Scorer, for any questions and information. Please feel free to contact us, using the contact information below:
Ruth Deutsch ruthdeutsch@coged.net
Jens Wilbrandt cap@neuroguide.dk
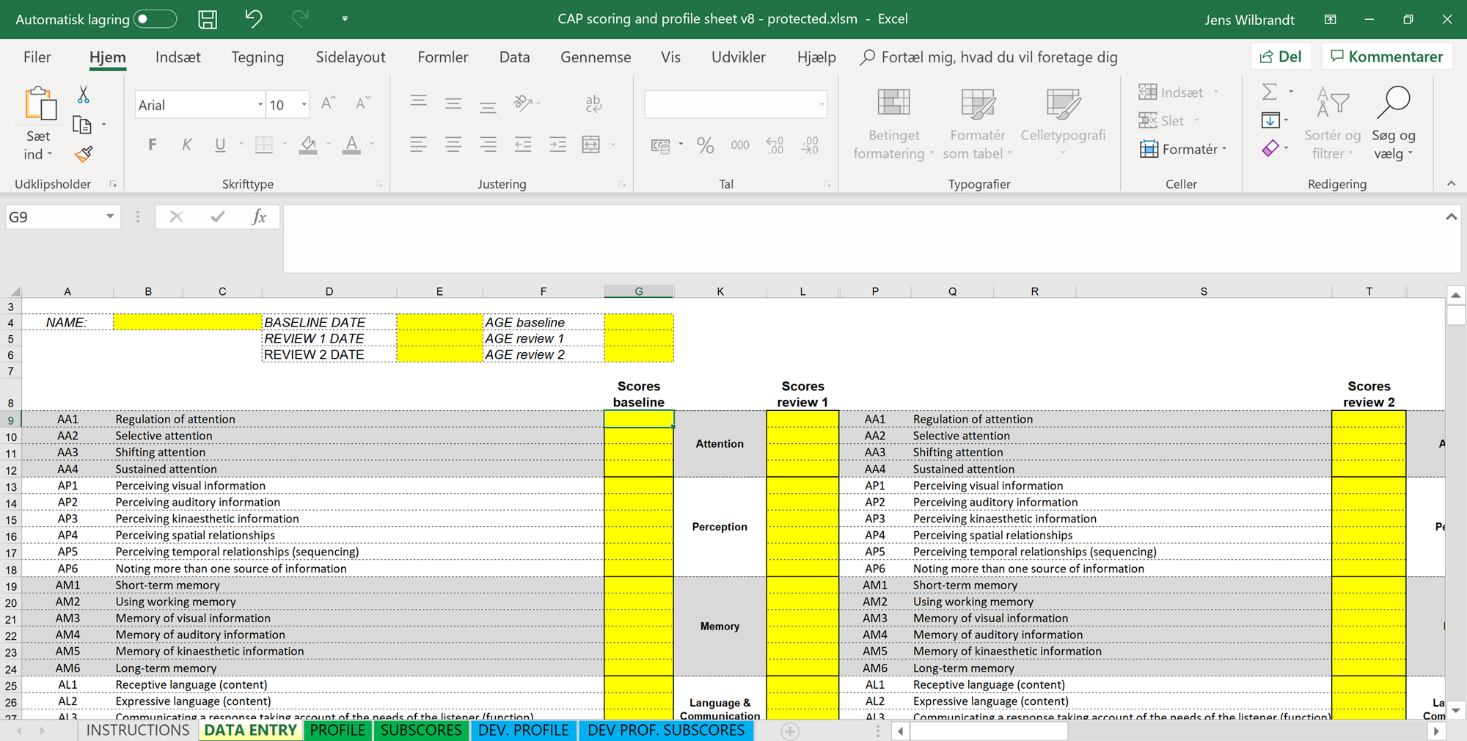 USING THE CAP DIGITAL SCORING TOOL
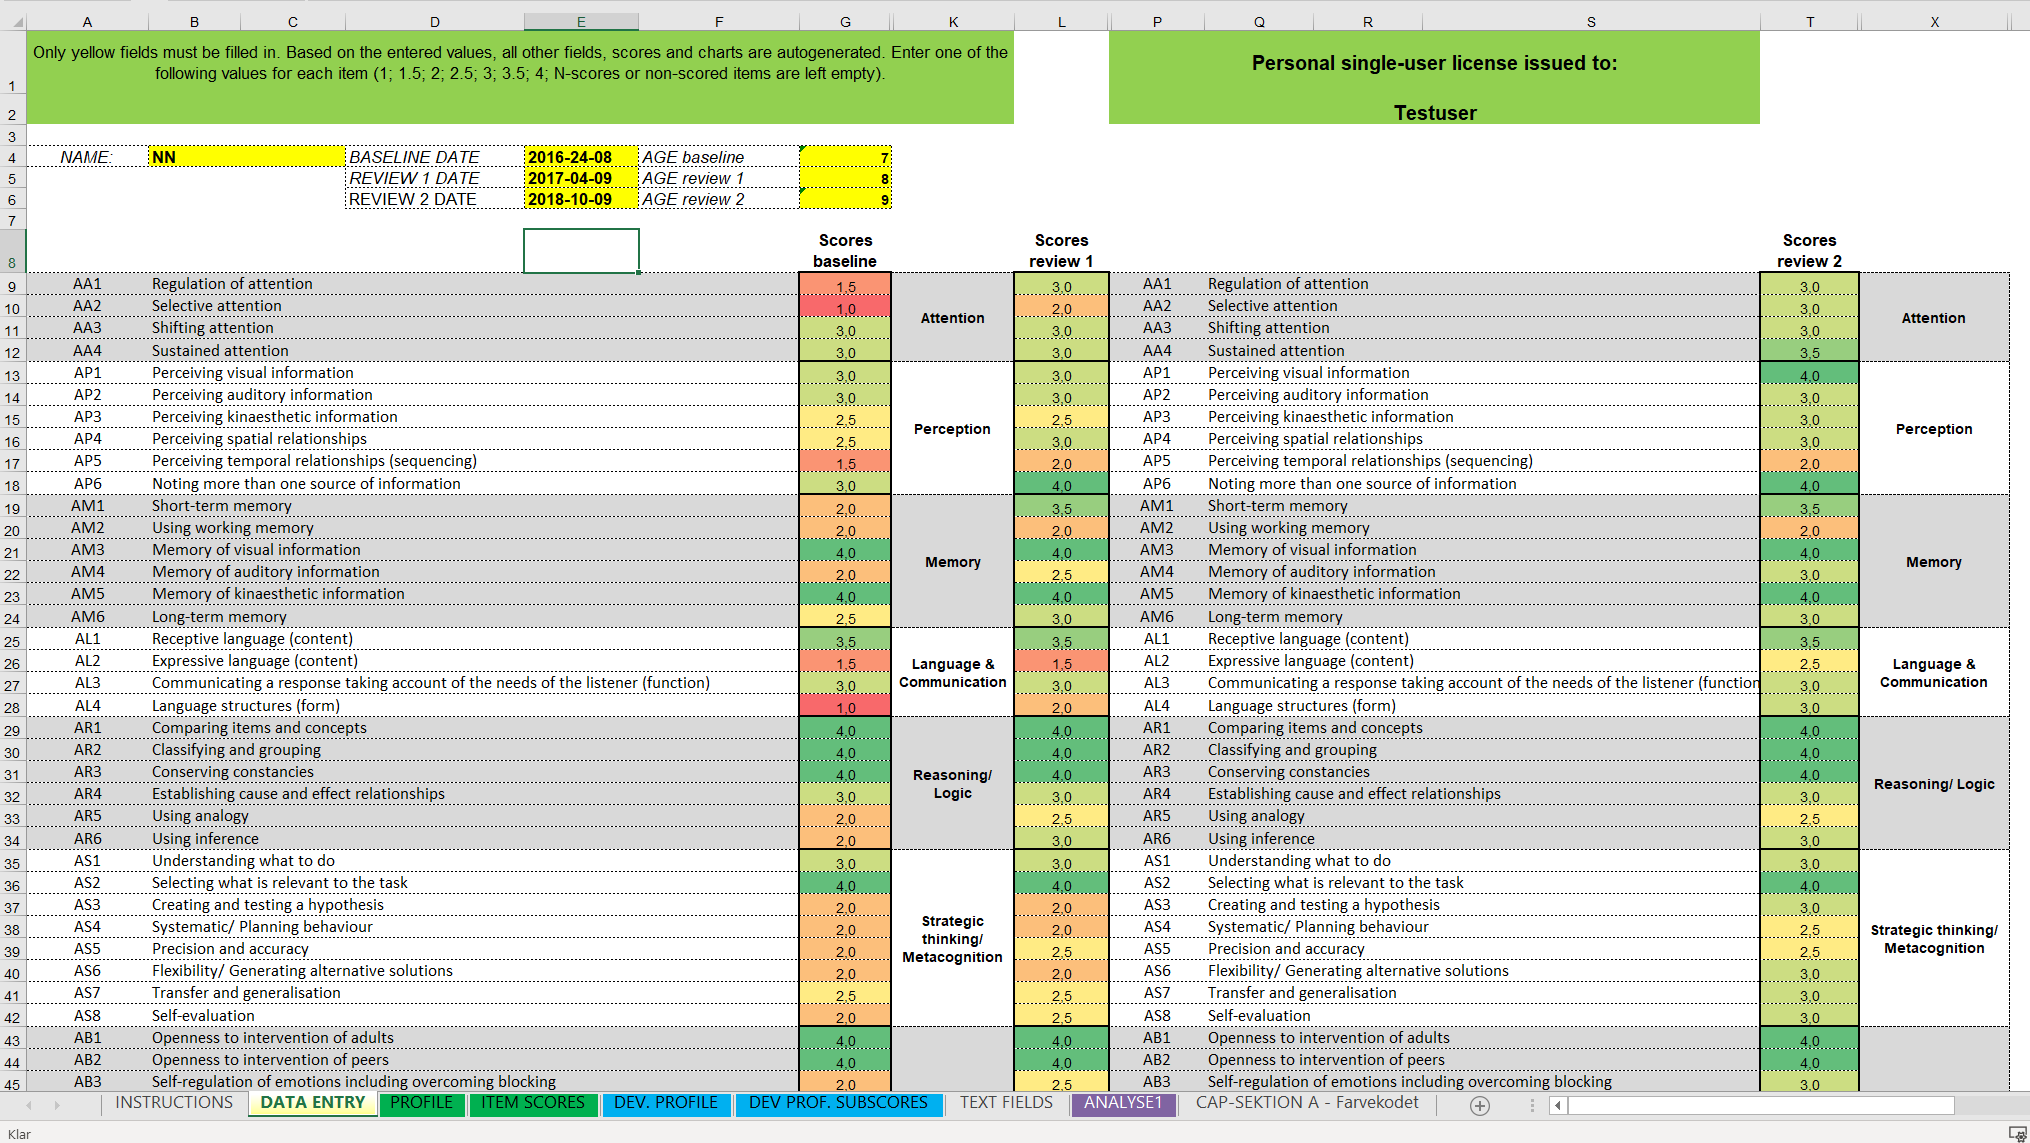
The CAP-Digital Scorer is intended for use after consultation. Data is entered on the error-protected Data Entry Sheet in the yellow fields. All other fields, scores and charts are auto-calculated based on entries. The scoring tool only calculates average profile scores if enough data are provided to ensure reliability.
Along with the CAP-Digital Scorer, your order includes step-by-step instructions.
Example of a full CAP data entry:
Overview of graphics provided by CAP-Digital Scorer
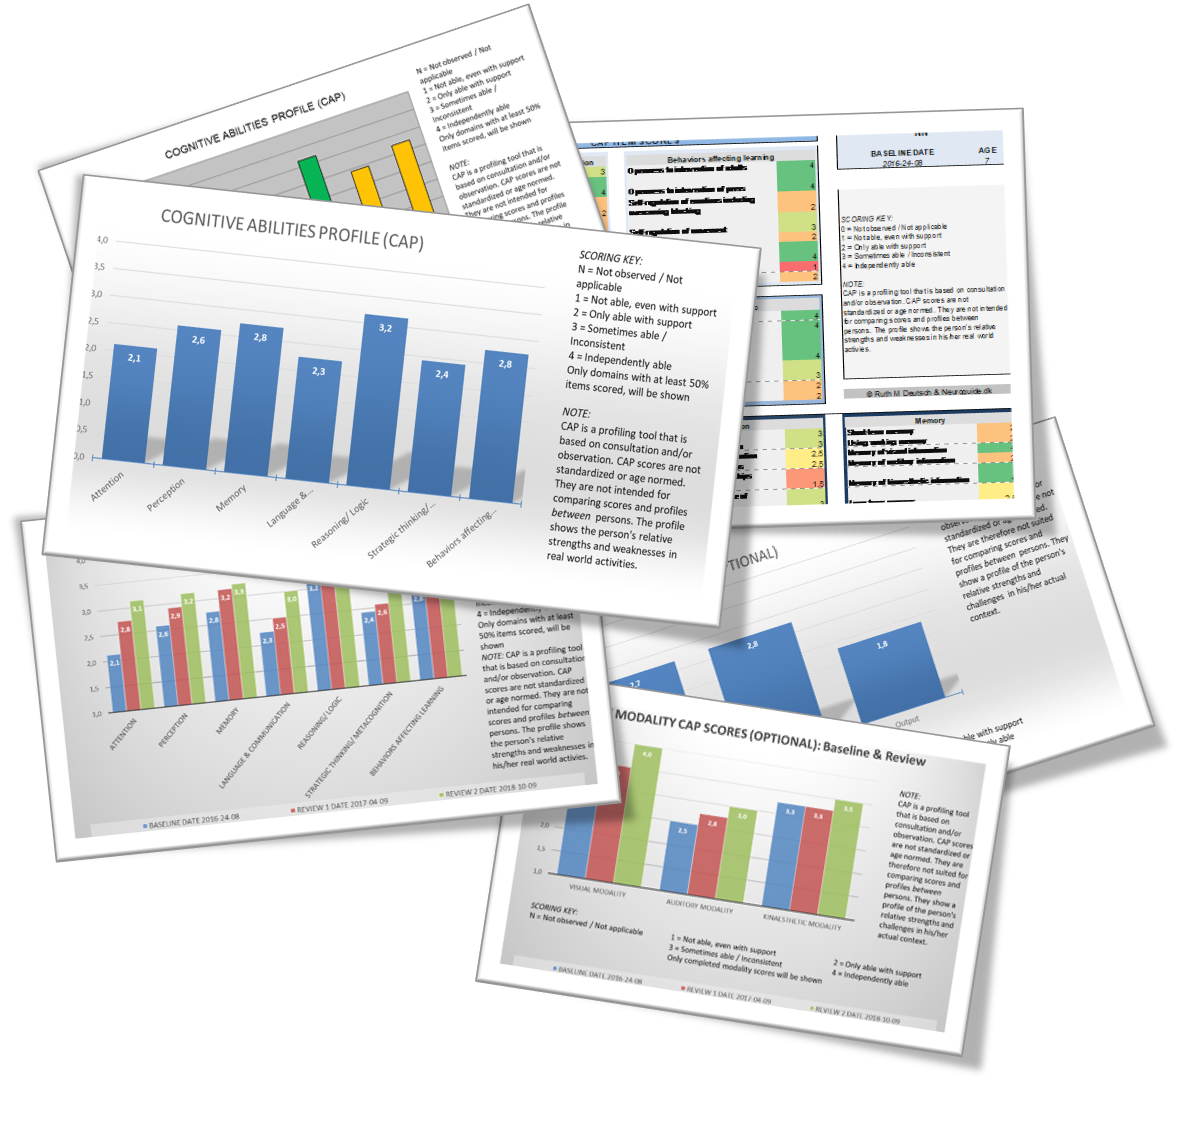
The CAP Digital Scorer provides you with the following graphics and overviews:
| Baseline (green section) | Review (blue section) | |
| Domain scores |
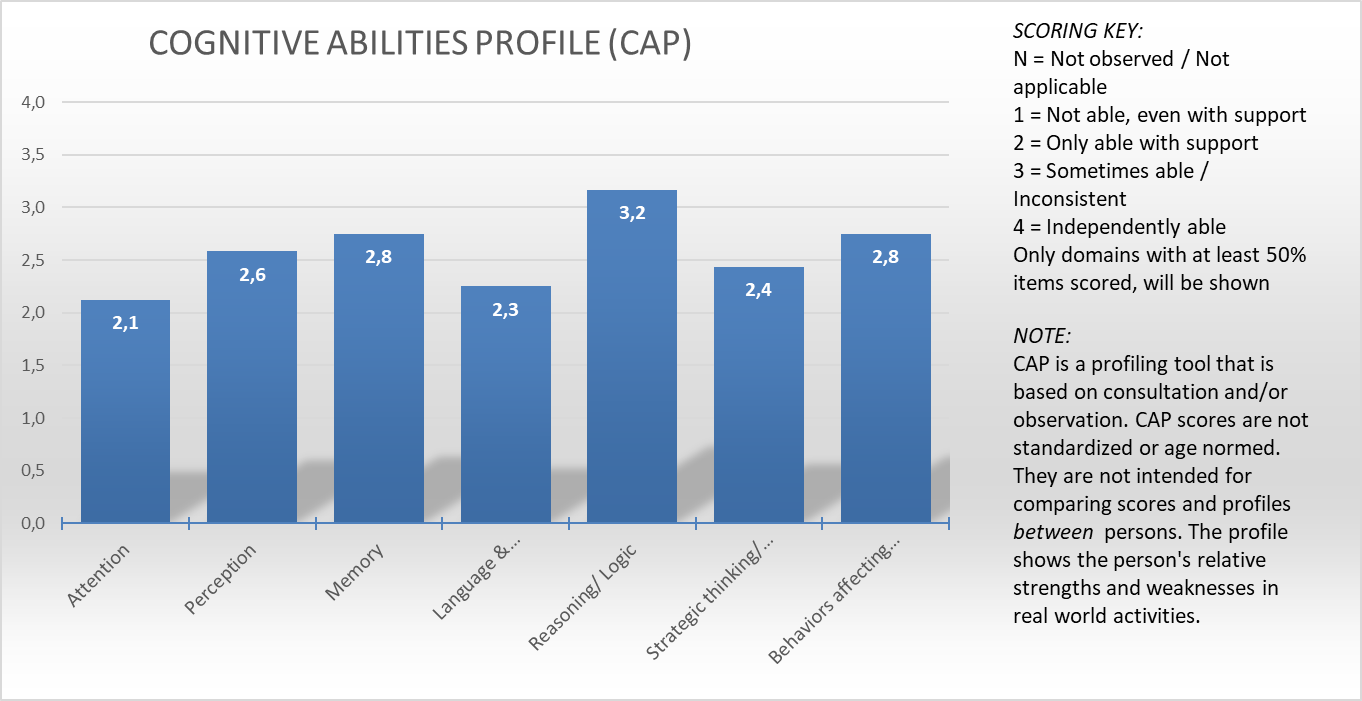
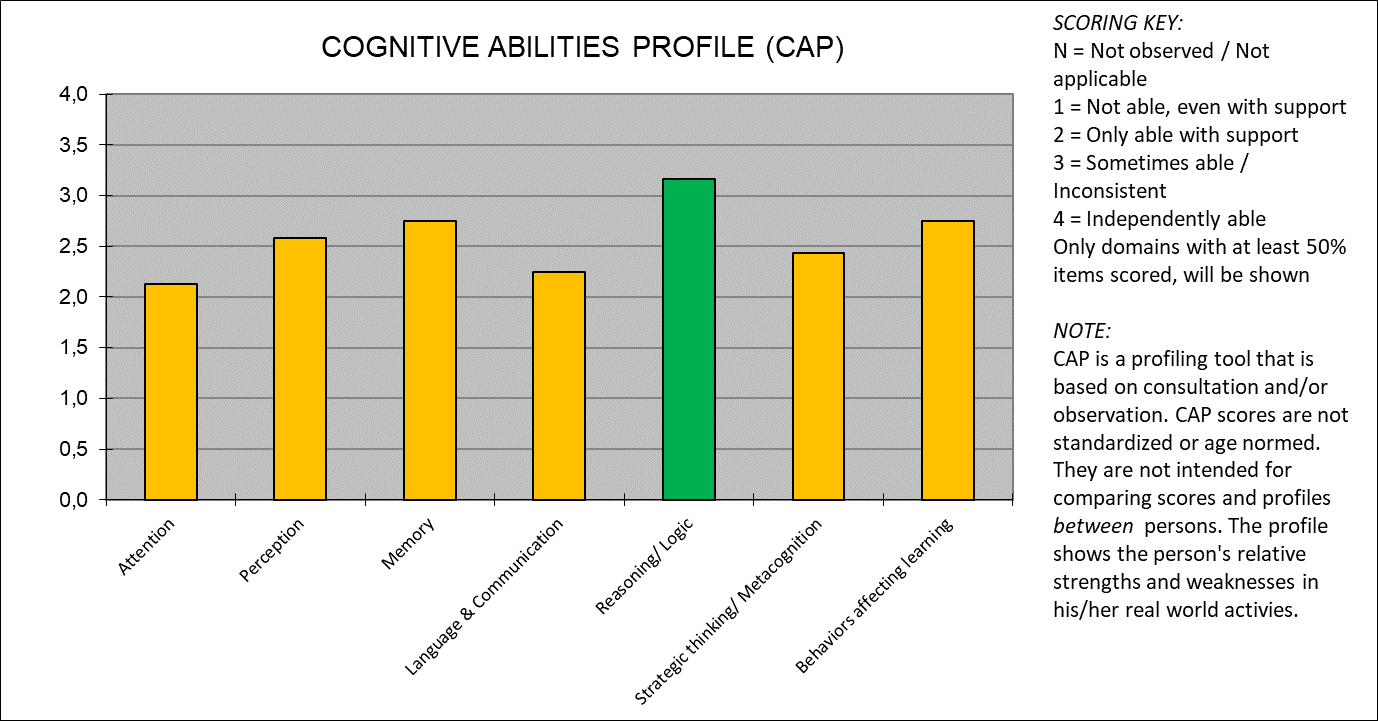
A. Uni colour bar chart of average domain scores B. Colour coded bar chart, emphasizing stronger (green), weaker (yellow) or low functioning (red) domains |
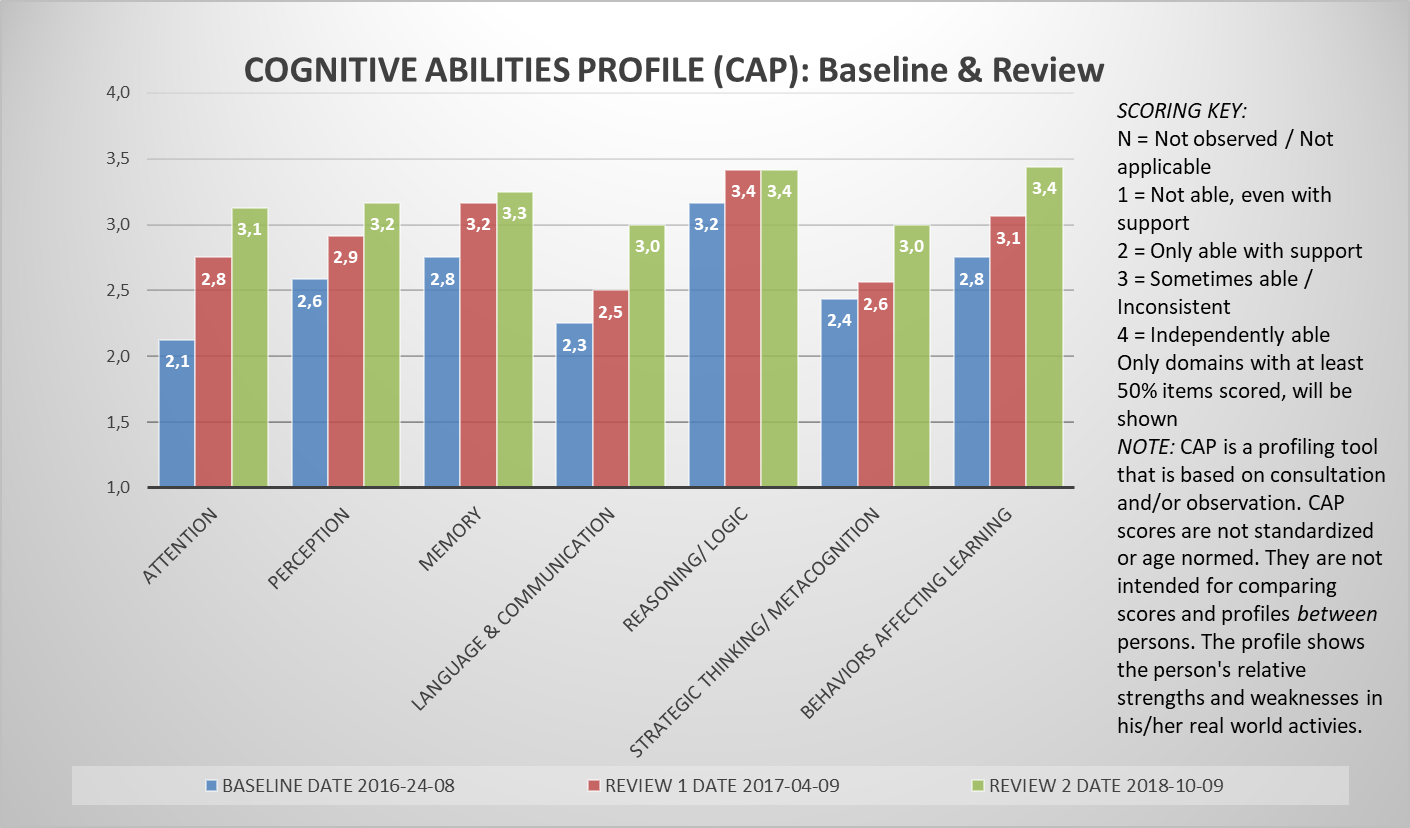
F. Bar chart of average domain scores for ease of comparison of progress over time |
|
Phase (optional) |
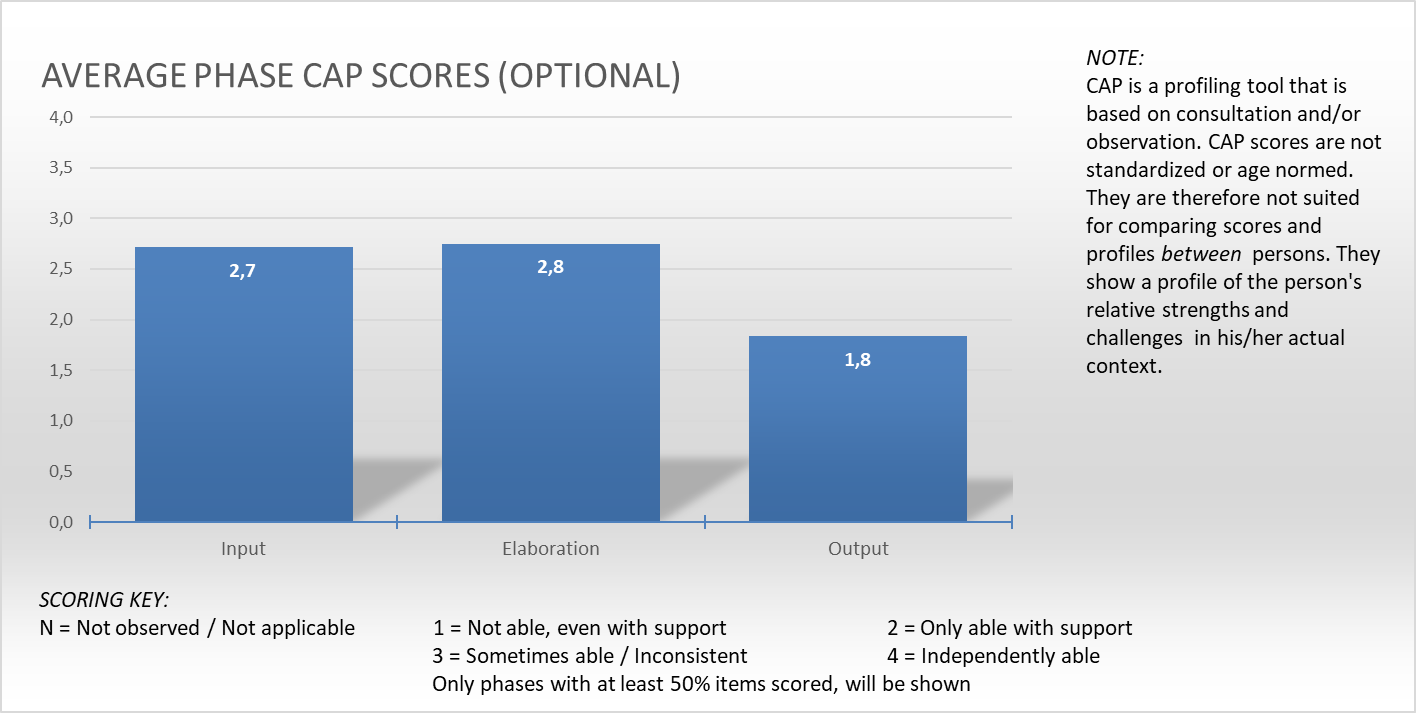
C. Average phase score bar chart according to Feuerstein´s phase model (input – elaboration – output) |
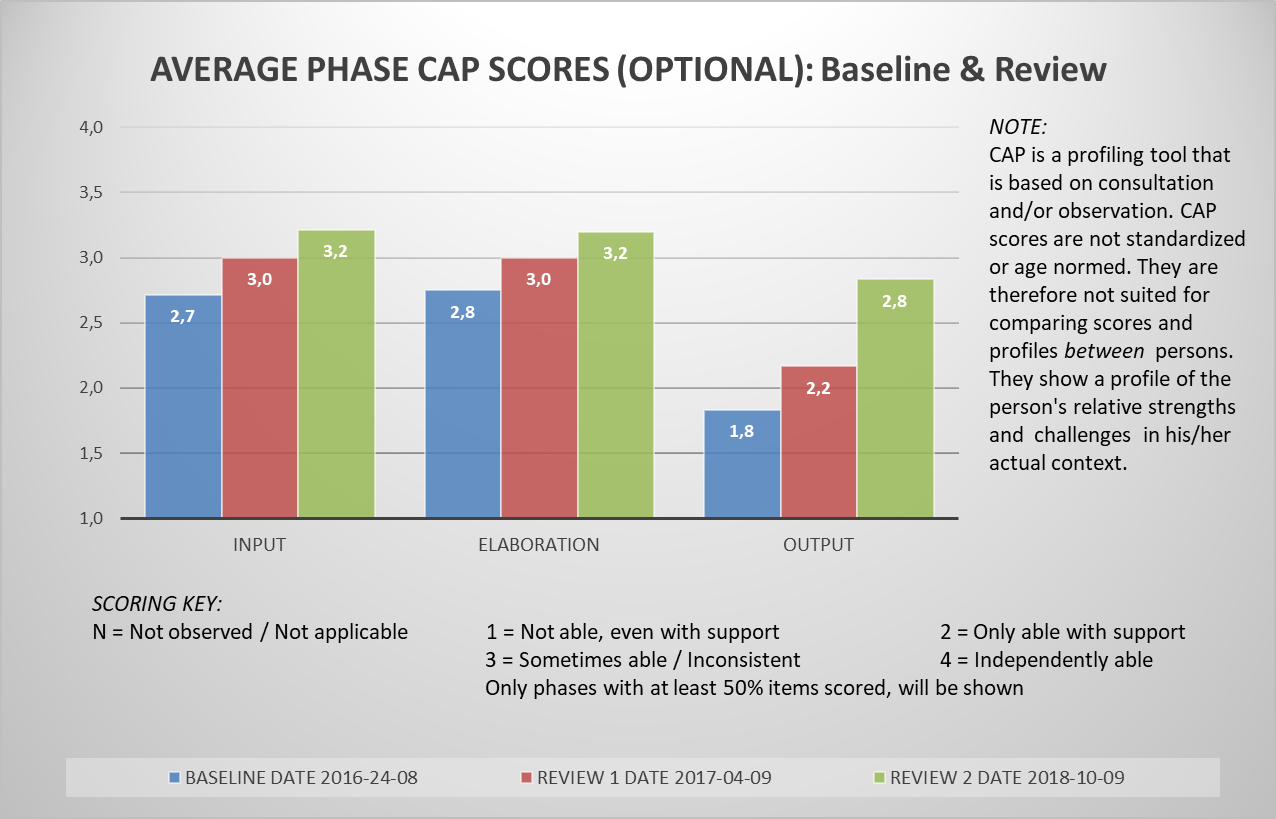
G. Bar chart of average phase scores, comparing baseline and review(s) |
|
Modality (optional) |
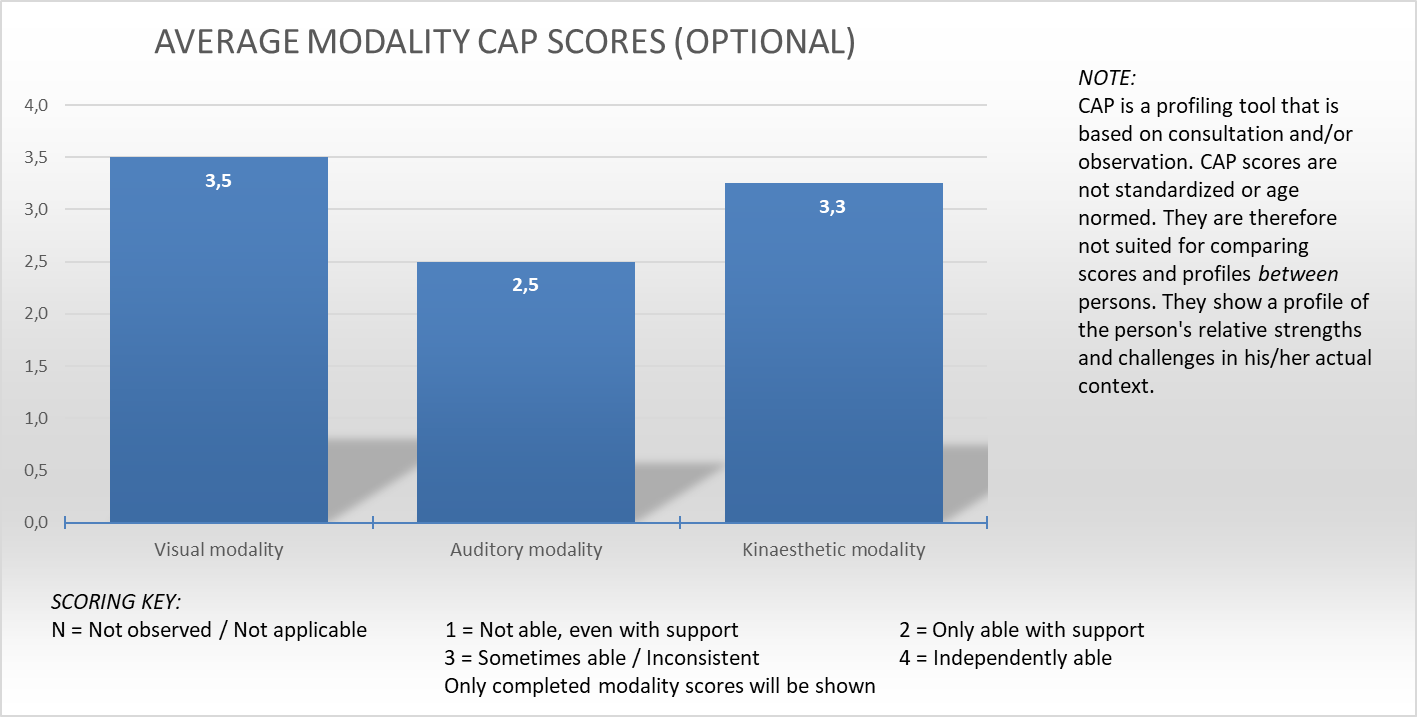
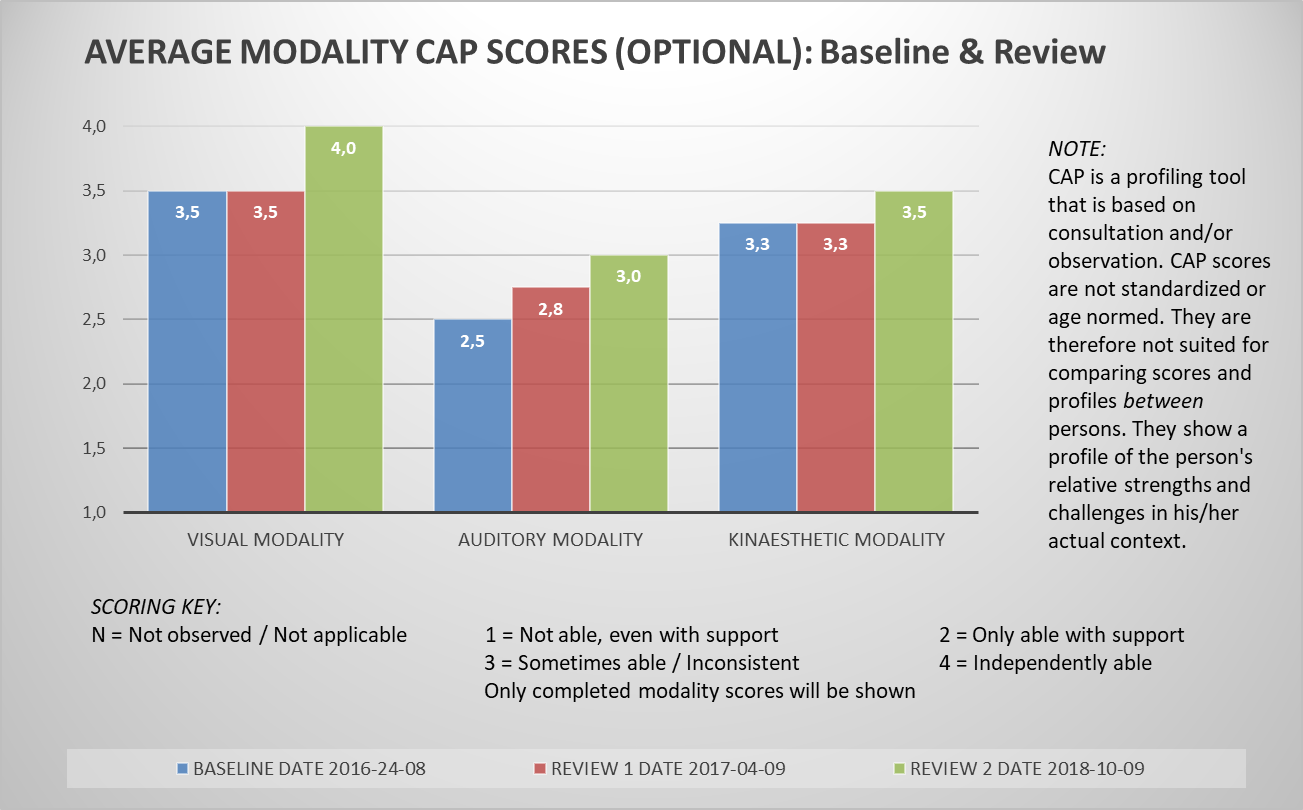
D. Average modality scores bar chart (visual – auditive – kinaesthetic) | H. Bar chart of average modality scores, comparing baseline and review(s) |
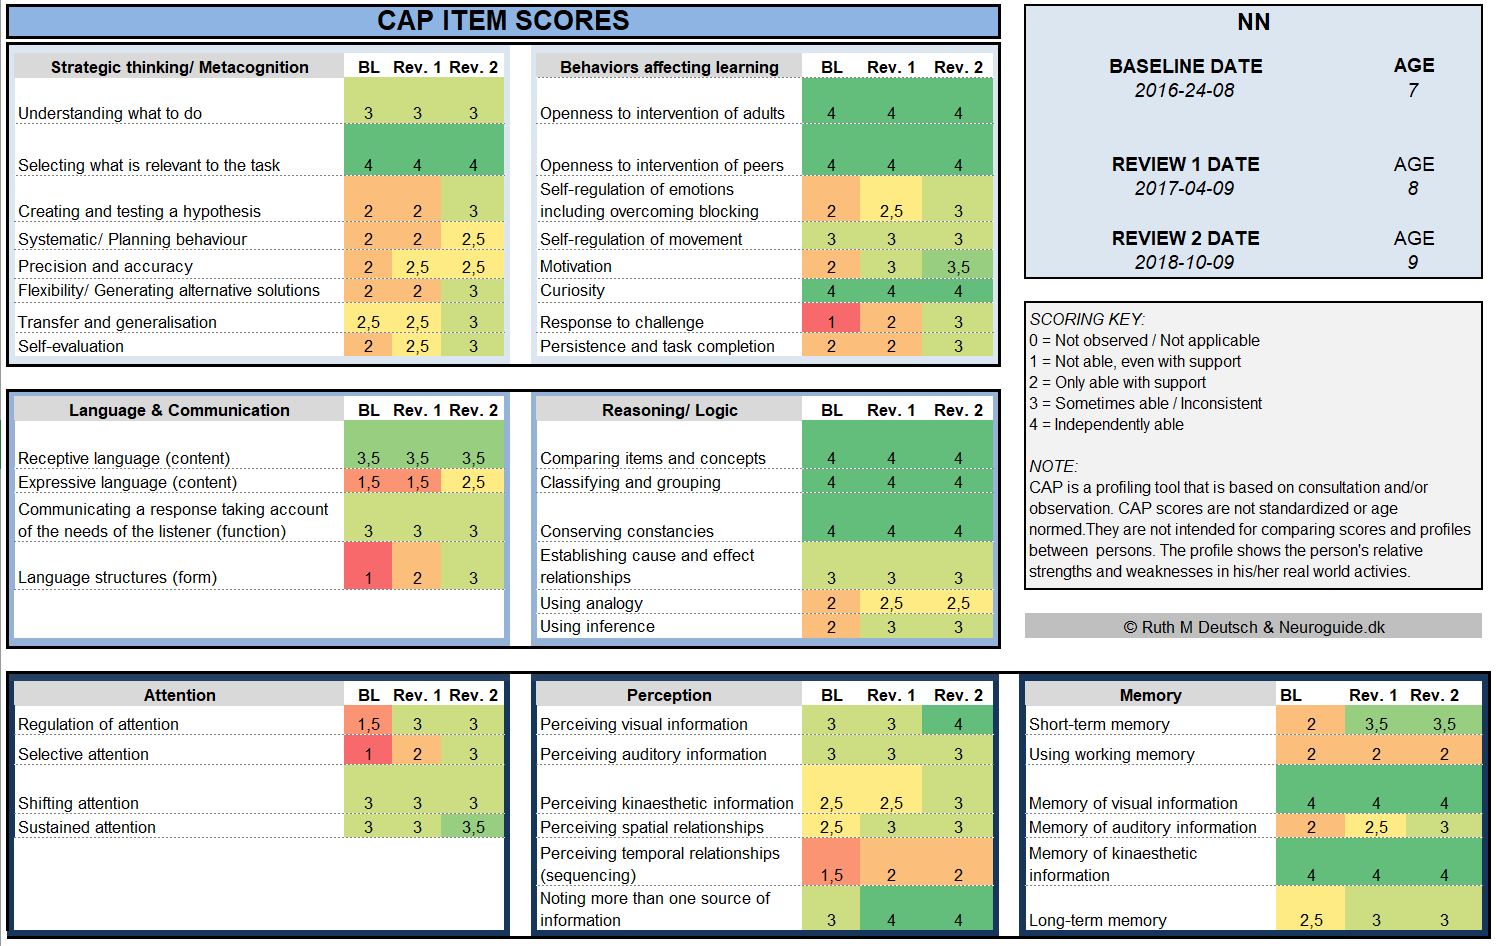
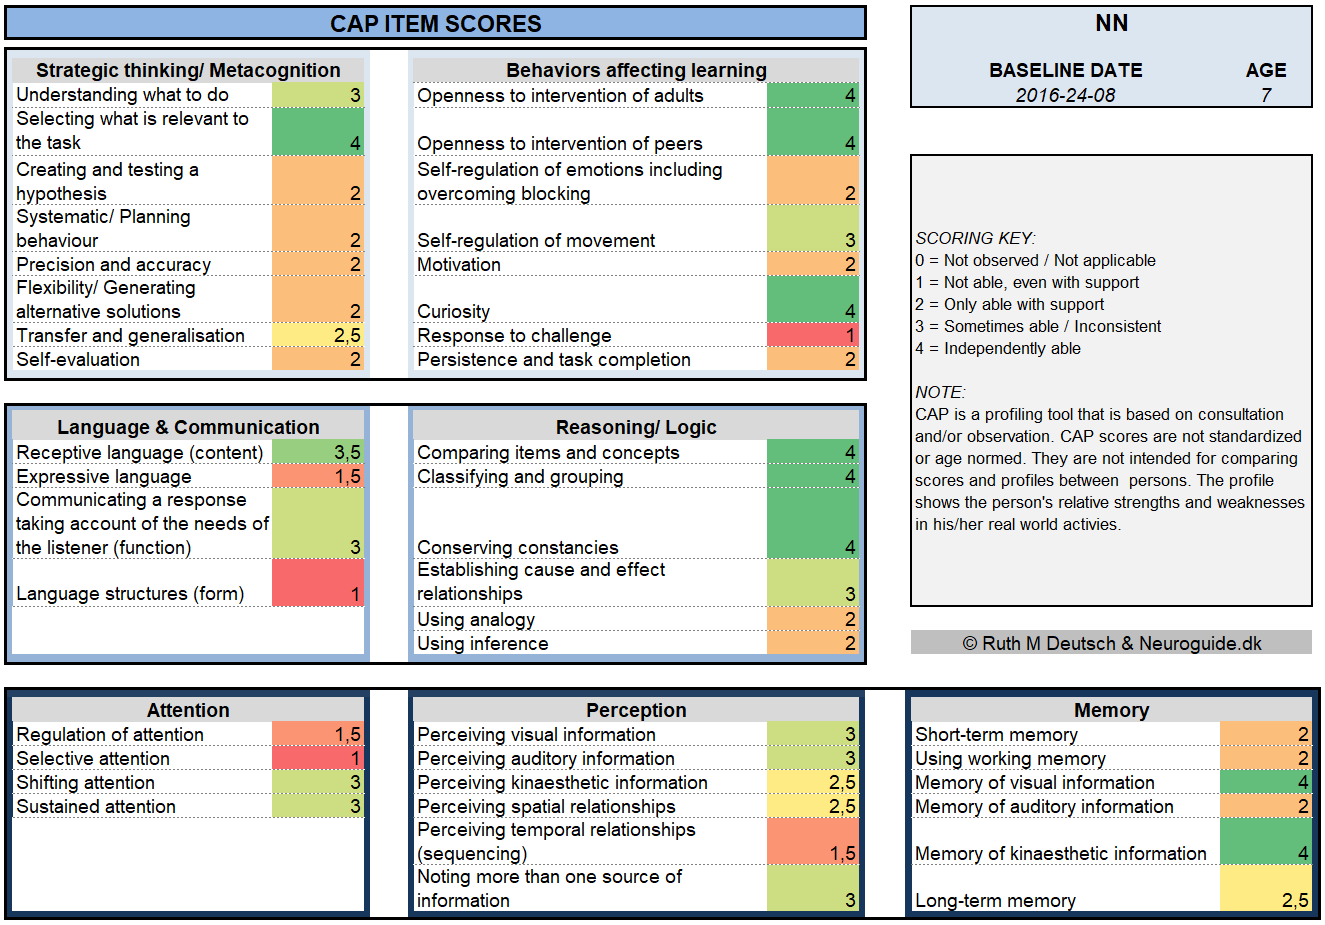
| Item overview | E. Overview of colour-coded item scores, showing stronger and less adequate items on an individual basis | I. Overview of colour coded item scores, with baseline and review scores next to each other, for easy comparison of progress over time |
Examples
Below you can see examples of the different graphics, all available for direct print or import and integration into reports.
A. Uni-colour bar chart of average domain scores
B. Colour coded bar chart, emphasizing stronger (green), weaker (yellow) or low functioning (red) domains
C. Average phase score bar chart according to Feuerstein´s phase model (input – elaboration – output)
D. Average modality score bar chart (visual – auditory – kinaesthetic)
E. Overview of colour-coded item scores, showing stronger and less adequate items on an individual basis
F. Bar chart of average domain scores for ease of comparison of progress over time
G. Bar chart of average phase scores, comparing baseline and review(s)
H. Bar chart of average modality scores, comparing baseline and review(s)
I. Overview of colour coded item scores, with baseline and review scores next to each other, for easy comparison of progress over time
